Open Source SIEM Build
Overview
In this blog, you will explore how to integrate Suricata with Elasticsearch, Kibana, Filebeat, and Winlogbeat to begin creating your own Security Information and Event Management (SIEM) tool using the Elastic stack and Ubuntu. SIEM tools are used to collect, aggregate, store, and analyze event data to search for security threats and suspicious activity on your networks and servers.
The components that you will use to build your own SIEM tool are:
- Elasticsearch to store, index, correlate, and search the security events that come from your Suricata server.
- Kibana to display and navigate around the security event logs that are stored in Elasticsearch.
- Filebeat to parse Suricata’s eve.json log file and send each event to Elasticsearch for processing.
- Suricata to scan your network traffic for suspicious events, and either log or drop invalid packets.
Suricata
Suricata is a Network Security Monitoring (NSM) tool that uses sets of community-created and user-defined signatures (also referred to as rules) to examine and process network traffic. Suricata can generate log events, trigger alerts, and drop traffic when it detects suspicious packets or requests to any number of different services running on a server.
Inastalling Suricata
The Installation process is such an easy commands…
sudo add-apt-repository ppa:oisf/suricata-stable

sudo apt install suricata

sudo systemctl enable suricata.service
If the resulting command was as the following So you are good to continue.
suricata.service is not a native service, redirecting to systemd-sysv-install.
Executing: /lib/systemd/systemd-sysv-install enable suricata
Now you need to close the service to start configuring it.
sudo systemctl stop suricata.service
Configuring Suricata
The Suricata package from the OISF repositories ships with a configuration file that covers a wide variety of use cases. The default mode for Suricata is IDS mode, so no traffic will be dropped, only logged. Leaving this mode set to the default is a good idea as you learn Suricata. Once you have Suricata configured and integrated into your environment and have a good idea of the kinds of traffic that it will alert you about, you can opt to turn on IPS mode.
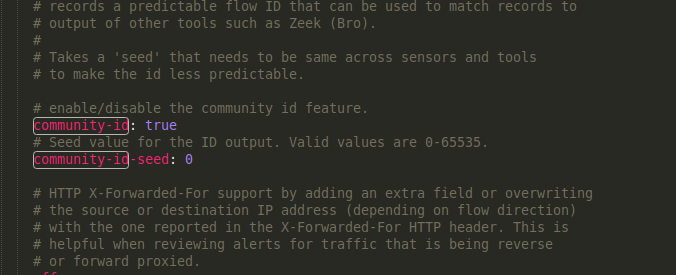
Enabling Community ID
Community ID helps you to Find the same event that was recorded from different Solutions. Suricata can include a Community ID field in its JSON output to make it easier to match individual event records to records in datasets generated by other tools.
To enable the option, open “/etc/suricata/suricata.yaml” and change the “Community-ID” field to “true”
sudo nano /etc/suricata/suricata.yaml
Determining Which Network Interfaces To Use
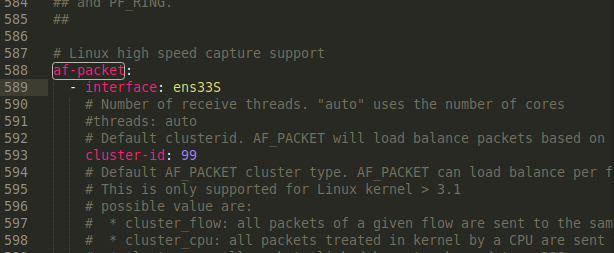
You may need to override the default network interface or interfaces that you would like Suricata to inspect traffic on. The configuration file that comes with the OISF Suricata package defaults to inspecting traffic on a device called eth0. If your system uses a different default network interface, or if you would like to inspect traffic on more than one interface, then you will need to change this value.
To determine the device name of your default network interface, you can use the ip command as follows…
ip -p -j route show default
output…
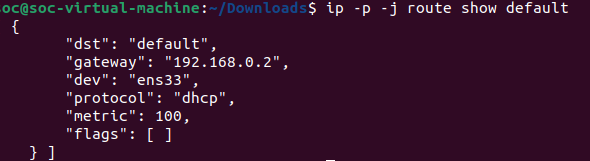
Now you can edit Suricata’s configuration and verify or change the interface name. Open the “/etc/suricata/suricata.yaml” configuration file.
sudo nano /etc/suricata/suricata.yaml
Live Reloading
Suricata supports live rule reloading, which means you can add, remove, and edit rules without needing to restart the running Suricata process. To enable the live reload option, scroll to the bottom of the configuration file and add the following lines:
detect-engine:
    - rule-reload: true
Updating Suricata Rulesets
At The beginning Suricata shipped with a small number of rules, So there is a tool called “suricata-update” that can fetch rulesets from external providers.
sudo suricata-update
Running this will give us the following output which tells us the number of rules added and their location.

Note:
  Suricata have a list of providers some of them are free and others are commercial and you can list them and choose between them using the "suricata-update" tool.
Validating Suricata’s Configuration
Now that you have edited Suricata’s configuration file to include the optional Community ID, specify the default network interface, and enabled live rule reloading, it is a good idea to test the configuration.
Suricata has a built-in test mode that will check the configuration file and any included rules for validity. Validate your changes from the previous section using the -T flag to run Suricata in test mode. The -v flag will print some additional information, and the -c flag tells Suricata where to find its configuration file
sudo suricata -T -c /etc/suricata/suricata.yaml -v
Once your Suricata test mode run completes successfully you can move to the next step, which is starting Suricata in daemon mode.
Running Suricata
Now we are able to Run Suricata Service.
sudo systemctl start suricata.service
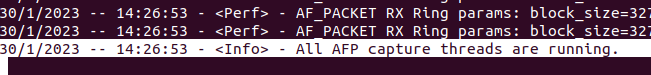
As with the test mode command, it will take Suricata a minute or two to load and parse all of the rules. You can use the tail command to watch for a specific message in Suricata’s logs that indicates it has finished starting.
sudo tail -f /var/log/suricata/suricata.log
And just keep waiting until the following message appears
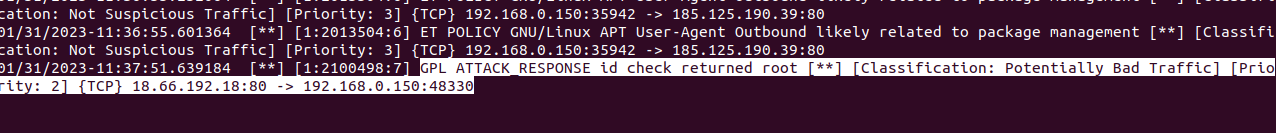
Testing Suricata Rules
For testing Suricata rules alert we will trigger one using “curl” with a site that returns data that looks like that returned from “id” command in Linux and that should create a log. So we will view the logs file with “tail” command and fire up the curl command that will trigger a specific rule.
sudo tail -f /var/log/suricata/fast.log

curl
And as expected, here is a catch.
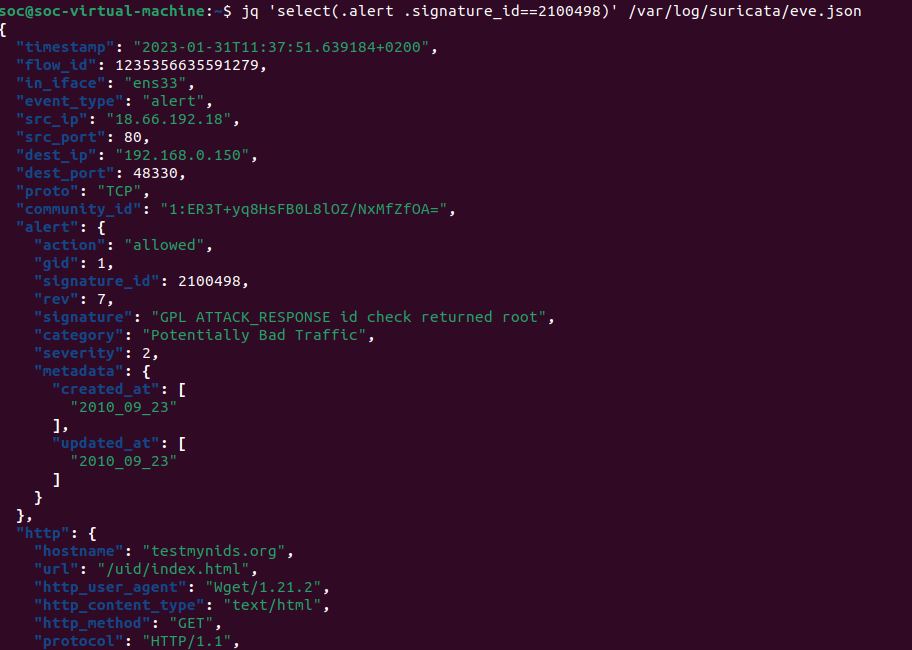
You can use the “jq” tool to search and parse the alerts.
sudo apt install jq

jq 'select(.alert .signature_id==2100498)' /var/log/suricata/eve.json
Elasticsearch and Kibana
Now we will create a new virtual machine that will act as our server where we will collect our logs into and also our visualizations. “You can use the same machine we used before for suricata but I did it this way to make it more extendable for future time”
Installing Elasticsearch and Kibana
Use the following commands to proceed with the installation process.
curl -fsSL https://artifacts.elastic.co/GPG-KEY-elasticsearch | sudo apt-key add -

echo "deb https://artifacts.elastic.co/packages/7.x/apt stable main" | sudo tee -a /etc/apt/sources.list.d/elastic-7.x.list

sudo apt update

sudo apt install elasticsearch kibana
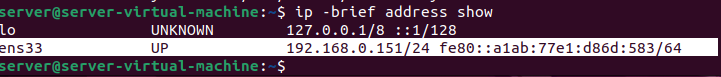
Then use the following command to show your IP and Interface that we will use during the configuration phase.
ip -brief address show
Configuring Elasticsearch
Configuring Elasticsearch Networking
We start by making it listening in the local interface
sudo nano /etc/elasticsearch/elasticsearch.yml
Find the commented-out #network.host: 192.168.0.1 line and add a new line after it that configures the “network.bind_host” setting.
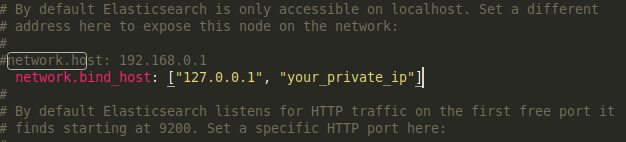
our private IP in place of the “your_private_ip” address.
Add the following two lines at the end of the file.
discovery.type: single-node
xpack.security.enabled: true
The discovery.type setting allows Elasticsearch to run as a single node, as opposed to in a cluster of other Elasticsearch servers. The xpack.security.enabled setting turns on some of the security features that are included with Elasticsearch.
Configuring Elasticsearch Passwords
Start Elasticsearch using the command
sudo systemctl start elasticsearch.service
You have enabled the xpack.security.enabled setting, and you need to generate passwords for the default Elasticsearch users. Elasticsearch includes a utility in the /usr/share/elasticsearch/bin directory that can automatically generate random passwords for these users.
cd /usr/share/elasticsearch/bin
sudo ./elasticsearch-setup-passwords auto
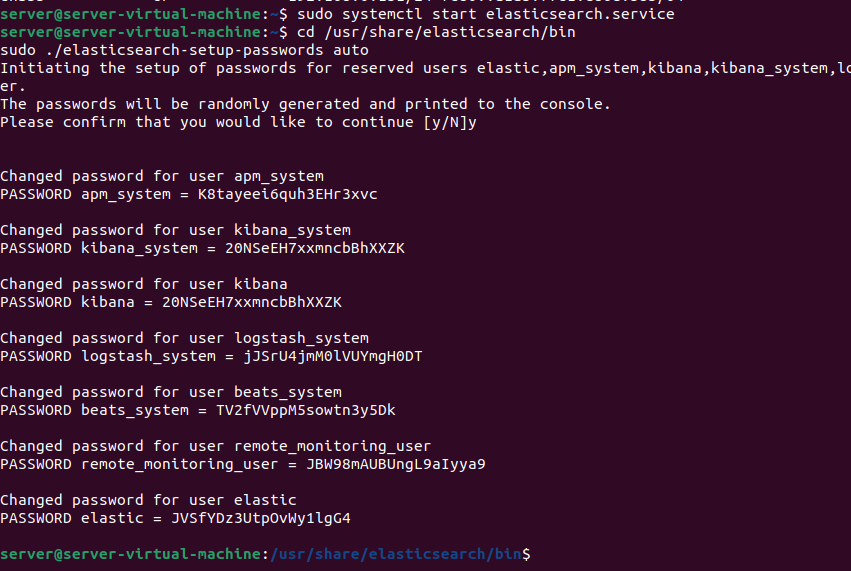
Make sure to save them in a good place as you will need them later.
Configuring Kibana
In the previous section of this tutorial, you configured Elasticsearch to listen for connections on your Elasticsearch server’s private IP address. You will need to do the same for Kibana so that Filebeats on your Suricata server can reach it.
First, you’ll enable Kibana’s xpack security functionality by generating some secrets that Kibana will use to store data in Elasticsearch. Then you’ll configure Kibana’s network setting and authentication details to connect to Elasticsearch.
Enabling xpack.security in Kibana
To get started with xpack security settings in Kibana, you need to generate some encryption keys. Kibana uses these keys to store session data (like cookies), as well as various saved dashboards and views of data in Elasticsearch.
You can generate the required encryption keys using the kibana-encryption-keys utility that is included in the /usr/share/kibana/bin directory. Run the following commands
cd /usr/share/kibana/bin/
sudo ./kibana-encryption-keys generate -q
Copy your output somewhere secure. You will now add them to Kibana’s /etc/kibana/kibana.yml configuration file. Now open kibana configuration and add the keys to the end of the file
sudo nano /etc/kibana/kibana.yml
Configuring Kibana Networking
To configure Kibana’s networking so that it is available on your Elasticsearch server’s private IP address, find the commented-out #server.host: “localhost” line in /etc/kibana/kibana.yml. Add a new line after it with your server’s private IP address.
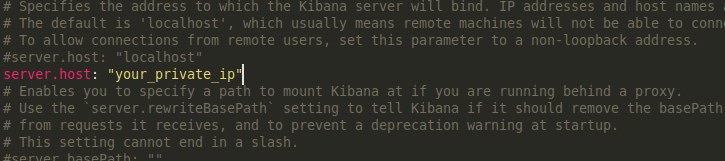
Next, you’ll need to configure the username and password that Kibana uses to connect to Elasticsearch.
Configuring Kibana Credentials
There are two ways to set the username and password that Kibana uses to authenticate to Elasticsearch. The first is to edit the /etc/kibana/kibana.yml configuration file and add the values there. The second method is to store the values in Kibana’s keystore, which is an obfuscated file that Kibana can use to store secrets.
We’ll use the keystore method in this tutorial since it avoids editing Kibana’s configuration file directly
If you prefer to edit the file instead, the settings to configure it are elasticsearch.username and elasticsearch.password.
If you choose to edit the configuration file, skip the rest of the steps in this section.
To add a secret to the keystore using the kibana-keystore utility, run the following command to set the username for Kibana and the password.
cd /usr/share/kibana/bin
sudo ./kibana-keystore add elasticsearch.username
sudo ./kibana-keystore add elasticsearch.password
Starting kibana
sudo systemctl start kibana.service
Filebeat
Filebeat is an agent used in Linux to forward the logs to the collecting server So we will start installing and configuring it to forward the logs from the suricata machine to the elastic server.
Installing Filebeat
Use the following commands to proceed with the installation.
curl -fsSL https://artifacts.elastic.co/GPG-KEY-elasticsearch | sudo apt-key add -

echo "deb https://artifacts.elastic.co/packages/7.x/apt stable main" | sudo tee -a /etc/apt/sources.list.d/elastic-7.x.list

sudo apt update

sudo apt install filebeat
Configuring Filebeat
Next, you’ll need to configure Filebeat to connect to both Elasticsearch and Kibana. Open the /etc/filebeat/filebeat.yml configuration file.
sudo nano /etc/filebeat/filebeat.yml
In the Kibana section add a new line “host: “your_private_ip:5601” with the private IP of the server after the commented line “#host: “localhost:5601”” as follows.
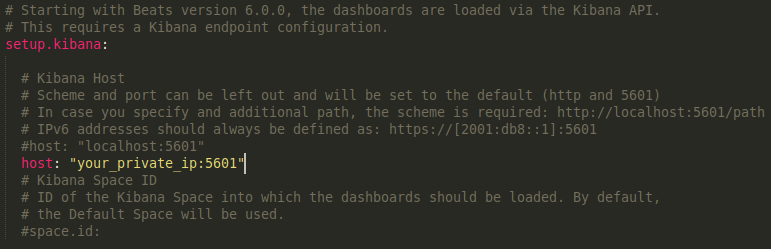
This change will ensure that Filebeat can connect to Kibana in order to create the various SIEM indices, dashboards, and processing pipelines in Elasticsearch to handle your Suricata logs.
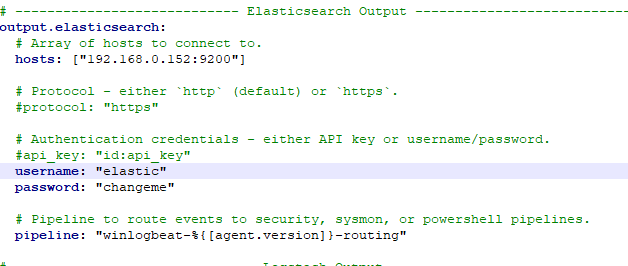
Next, find the Elasticsearch Output section of the file and edit the hosts, username, and password settings to match the values for your Elasticsearch server
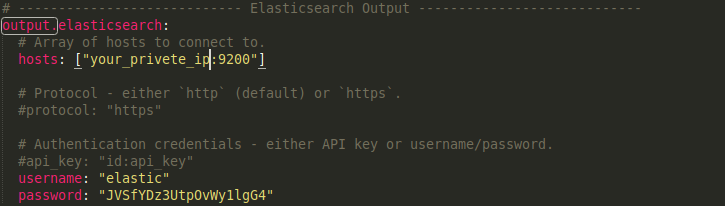
Substitute in your Elasticsearch server’s private IP address on the hosts line in place of the your_private_ip value. Uncomment the username field and leave it set to the elastic user. Change the password field from changeme to the password for the elastic user that you generated in the “Configuring Elasticsearch Passwords” section
Now you can enable Filebeats’ built-in Suricata module with the following command
sudo filebeat modules enable suricata
Now that Filebeat is configured to connect to Elasticsearch and Kibana, with the Suricata module enabled, the next step is to load the SIEM dashboards and pipelines into Elasticsearch.
Run the filebeat setup command. It may take a few minutes to load everything.
sudo filebeat setup
If there are no errors, use the systemctl command to start Filebeat. It will begin sending events from Suricata’s eve.json log to Elasticsearch once it is running.
sudo systemctl start filebeat.service
Now that you have Filebeat, Kibana, and Elasticsearch configured to process your Suricata logs, the last step in this tutorial is to connect to Kibana and explore the SIEM dashboards.
If you encountered a “kibana is not ready yet” error and got stuck in trouble shooting, you can follow the following link Ready to use configuration
just copy and paste the configuration based on the instructions provided, and don’t forget to customize the Filebeat configuration according to the new password and user name for elastic. If still stuck and want to move on, you can simply disable xpack until you can troubleshoot the problem.
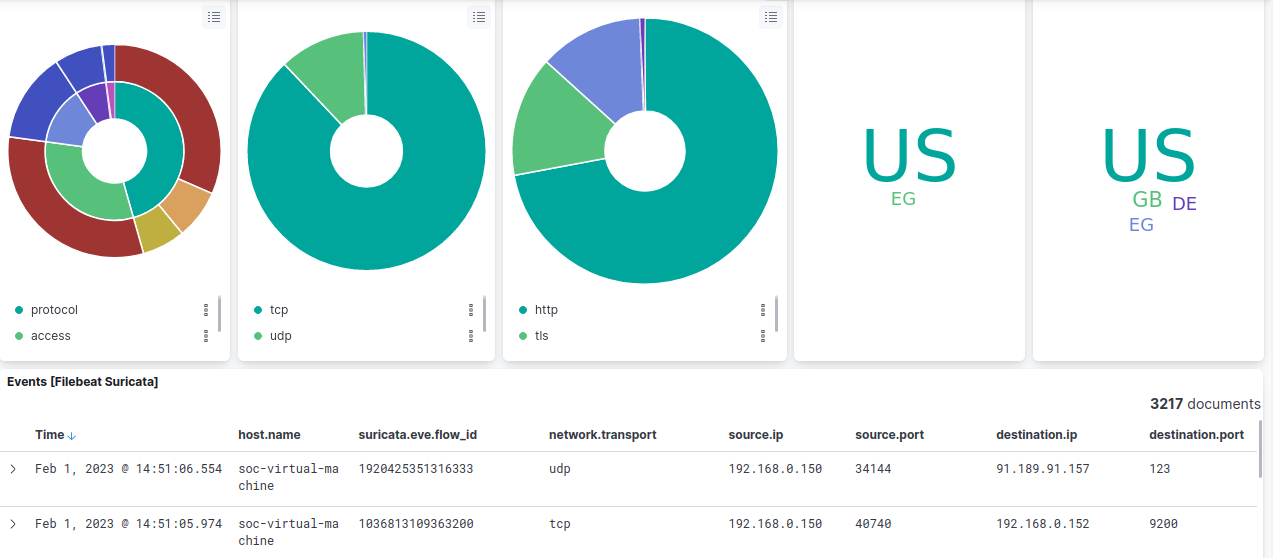
Browsing Kibana SIEM Dashboards
To display the logs sent by Filebeat you can search in the search bar with
type:dashboard suricata
Windows logs collection “Winlogbeat”
For the sake of more clarity we will add another log source to our SIEM which is windows event logs. We will need a windows machine to collect the events from So you can set up one as a virtual machine.
Installation
- download Winlogbeat from the link below
- Extract the contents into C:\Program Files.
- Rename the winlogbeat-
directory to Winlogbeat. - Open a PowerShell prompt as an Administrator (right-click on the PowerShell icon and select Run As Administrator).
-
From the PowerShell prompt, run the following commands to install the service.
  cd 'C:\Program Files\Winlogbeat'
  .\install-service-winlogbeat.ps1
Configure Winlogbeat
Open the “winlogbeat.yml” file to start configuration editting.
In the Elasticsearch section enter your elastic server ip, username, and password
Under winlogbeat.event_log, specify a list of event logs to monitor. By default, Winlogbeat monitors application, security, and system logs.
winlogbeat.event_logs:
  - name: Application
  - name: Security
  - name: System
To obtain a list of available event logs, run Get-EventLog * in PowerShell. For more information about this command, see the configuration details for event_logs.name.
(Optional) Set logging options to write Winlogbeat logs to a file:
logging.to_files: true
logging.files:
  path: C:\ProgramData\winlogbeat\Logs
logging.level: info
After you save your configuration file, test it with the following command.
.\winlogbeat.exe test config -c .\winlogbeat.yml -e
Now you can run the following commands to actually start the service
.\winlogbeat.exe setup -e
Start-Service winlogbeat
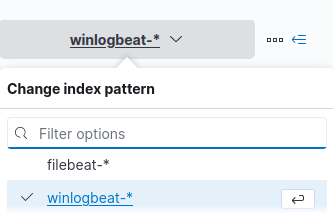
Going to our kibana we will find the new source “winlogbeat” added
Referencess
“Jamon Camisso” article at Digital Ocean.